
“Exxon was aware of climate change, as early as 1977, 11 years before it became a public issue… This knowledge did not prevent the company from spending decades refusing to publicly acknowledge climate change and even promoting climate misinformation — an approach many have likened to the lies spread by the tobacco industry regarding the health risks of smoking.”
Scientific American
(October 2015)
January 24 2022 — In the early 80s, oil companies like Exxon and Shell carried out internal assessments of the carbon dioxide released by fossil fuels, and forecast the planetary consequences of these emissions. How accurate were those predictions? Short answer: very good. And if they had not made a silly mistake — never reported before — the Exxon predictions would have been amazingly correct. PS — Please, keep in mind that in those years, the CIA expected a new ice age! Obviously, Corporate Intelligence beats the Central Intelligence Agency. Follow us on Twitter: @INTEL_TODAY
RELATED POST: Earth Day 2021 — CIA : “Climatological Research as it Pertains to Intelligence Problems”
RELATED POST: On This Day — US Surgeon General Report Links Tobacco and Cancer (January 11 1964) [Disinformation : Why does it work?]
“ExxonMobil predicted global warming correctly and skillfully.”
Assessing ExxonMobil’s global warming projections
SCIENCE (January 2023)
UPDATE (January 14 2023) — As you may know, my blog has been plagiarized a few times in recent years. The last time, it was about the assassination of Dag Hammarskjold.
RELATED POST : EXCLUSIVE — Belgian Mercenary Killed Dag Hammarskjold // UPDATE — Story Confirmed!
But this time is unusual. My work appears without due credit in the prestigious magazine SCIENCE!
Please, take a look at this article published yesterday by The GUARDIAN: “Revealed: Exxon made ‘breathtakingly’ accurate climate predictions in 1970s and 80s.”
And just compare that with what I wrote almost one year ago: “How accurate were those predictions? Short answer: very good. And if they had not made a silly mistake — never reported before — the Exxon predictions would have been amazingly correct.”
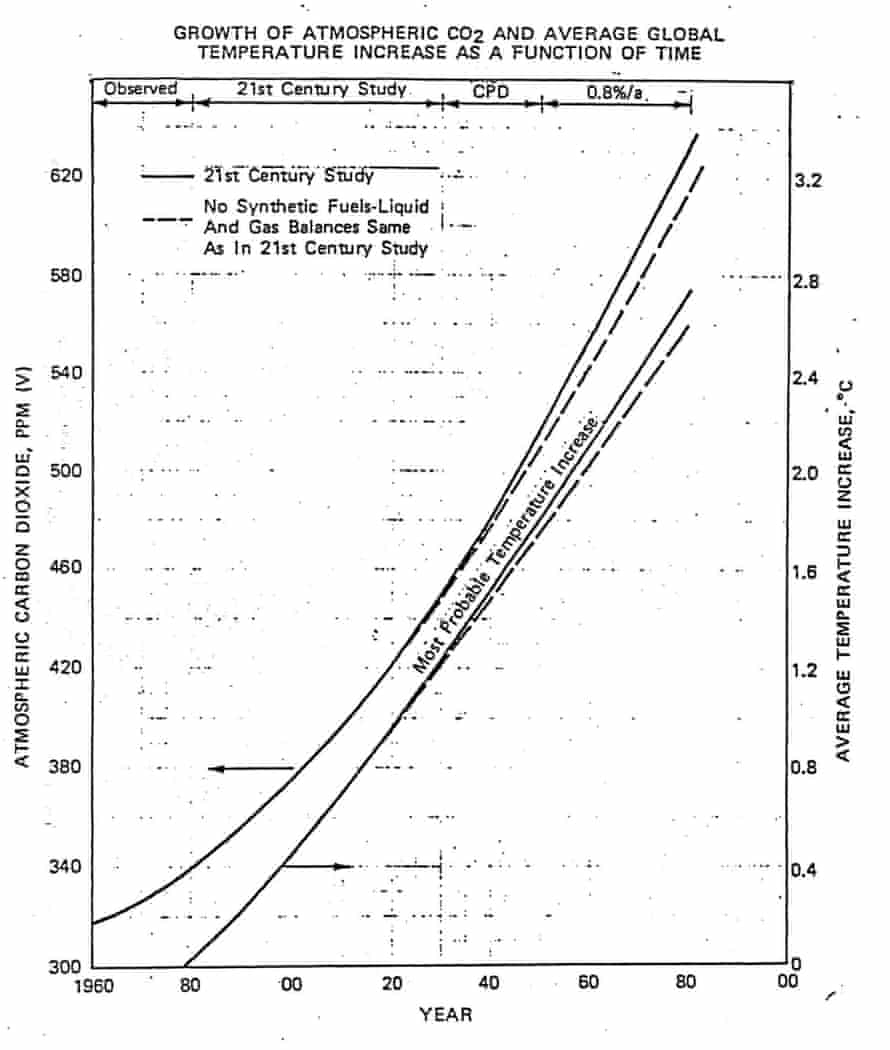
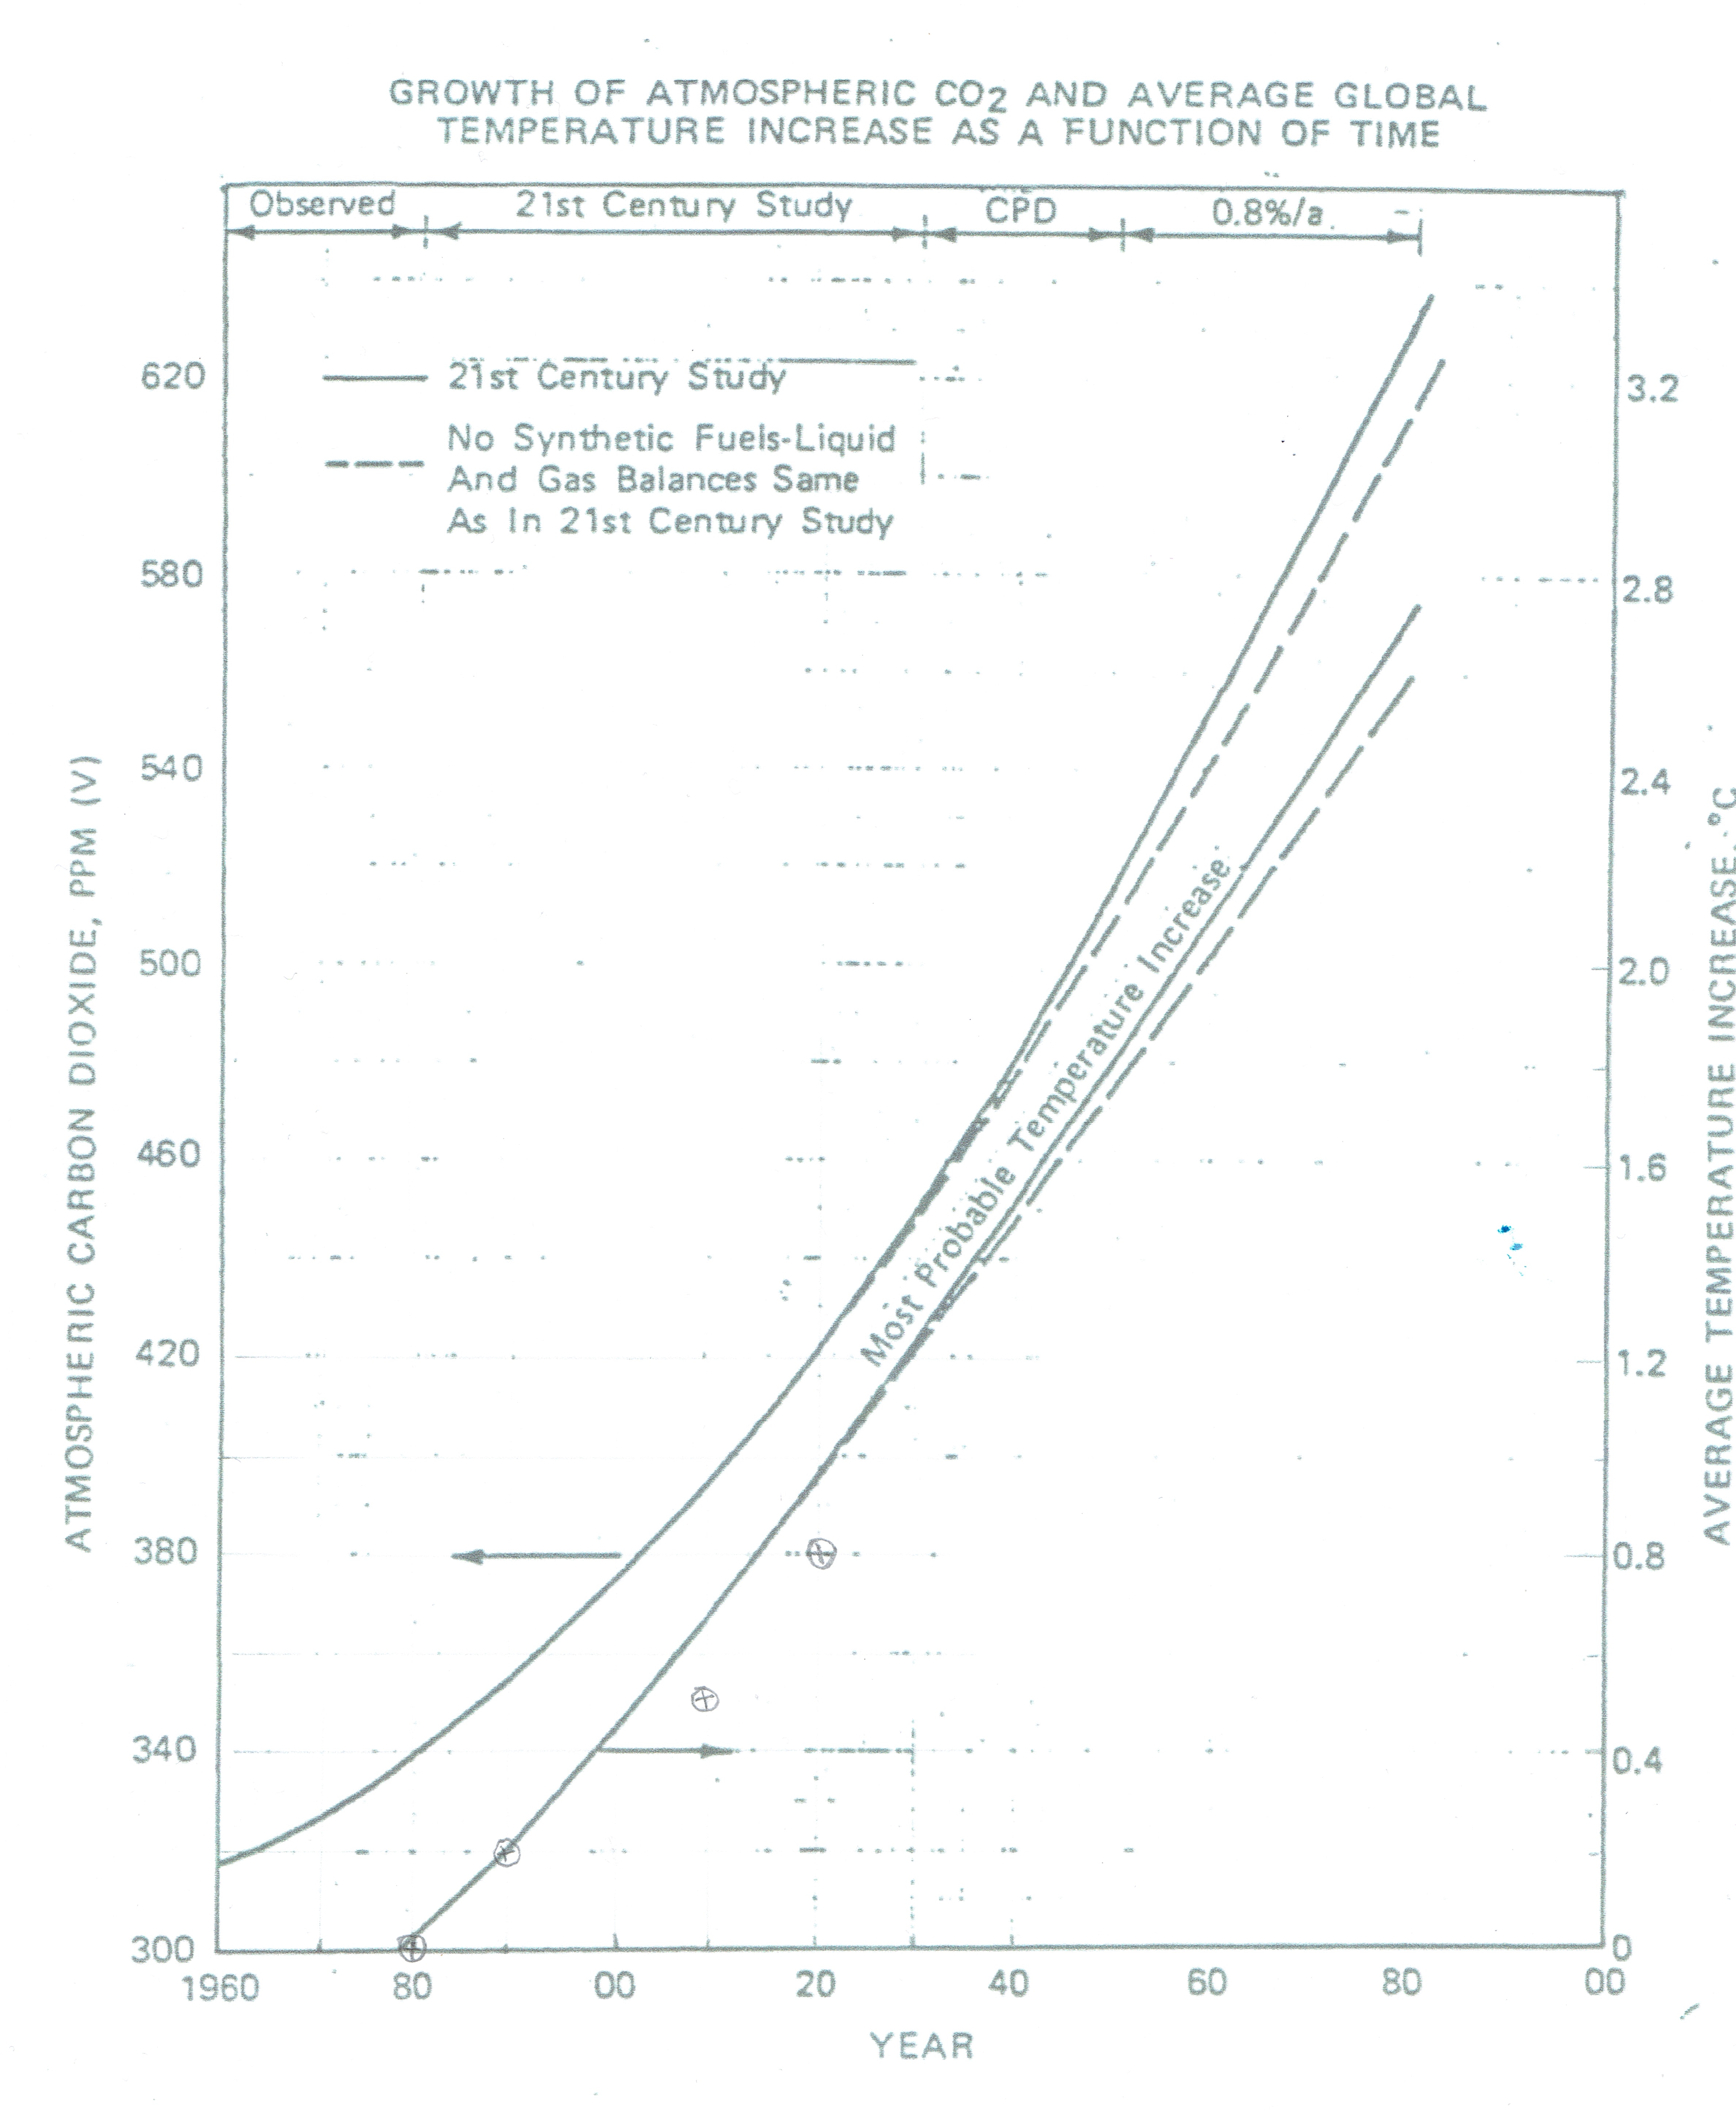
The article [Assessing ExxonMobil’s global warming projections] is available online. The conclusion is best explained by this single plot.

If imitation is the sincerest form of flattery, then I should feel immensely flattered, as the story about Exxon mobile looks ‘remarkably similar’ to my analysis…
The readers will notice at once that this plot is simply the exact equivalent of Figures 2 and 4 which I posted in January 2022!
According to The Guardian:
Drew Shindell, a climate scientist at Duke University, said the new study was a “detailed, robust analysis” and that Exxon’s misleading public comments about the climate crisis were “especially brazen” given their scientists’ involvement in work with outside researchers in assessing global heating. Shindell said it was hard to conclude that Exxon’s scientists were any better at this than outside scientists, however.
The new work provided “further amplification” of Exxon’s misinformation, said Robert Brulle, an environment policy expert at Brown University who has researched climate disinformation spread by the fossil fuel industry.
Allow me just a few quick comments.
I. “The new study is a detailed, robust analysis”– Seriously? Stupidly enough, Harvard researchers missed one of my most important conclusions. EXXON had made a small ‘stupid’ mistake. [See the section below: ‘Technical Note — Radiative forcing’] After correction, their prediction is even better! (From 20% to 10% accurate!)
II. According to the study, “Exxon scientists correctly sided with the majority of the peer-reviewed literature in the 1970s that foresaw human-caused global warming overwhelming any possibility of global cooling and a (natural) ice age.” I do not disagree. But this raises the obvious question. Why on earth was the CIA expecting a new ice age???
III. The last obvious question is this. What does the EXXON Model predict beyond 2020? On World Earth Day 2022 (April 22 2022), I used to the Exxon model [See update at the end of this post] and data from the U.S. Energy Information Administration (EIA) to predict that Earth average temperature will rise by about 0.12° C every five years until 2040.Time will tell…
IV. Most of you are probably surprised that Exxon scientists were able to make an accurate 40 years prediction. Let me shock you! Based on the Exxon CO2 prediction and the work of Syukuro Manabe (1967), it would have been straightforward to predict very accurately Earth global temperature increase for at least the next 50 years as early as 1970!
V. Allow me to repeat a key point. How did Exxon manage to get away with this? Actually, it was rather easy. They knew that people do not believe in science. And therefore they expected that people would not believe in global warming until it is being observed. But they also knew that it would take many decades (probably as much as 40 years) before global warming increases temperature above natural fluctuations which are of the order of 0.5°C. Therefore, they concluded — again very correctly — that governments would not do anything before at least 2020.
Stay tuned!
“A new study, however, has made clear that Exxon’s scientists were uncannily accurate in their projections from the 1970s onwards, predicting an upward curve of global temperatures and carbon dioxide emissions that is close to matching what actually occurred.”
The Guardian (Jan. 12 2023)
January 24 2022 — In 1982, Exxon predicted that CO2 levels would reach around 540 parts per million by 2060 and that this concentration would push the planet’s average temperatures up by 2°C over 1980 level.
These predictions have been reported in the media. [For instance : THE GUARDIAN — Shell and Exxon’s secret 1980s climate change warnings]
But the media have always avoided answering the obvious question. How accurate were those predictions?
Atmospheric CO2

NOAA started its own CO2 measurements in May of 1974, and they have run in parallel with those made by Scripps since then.
Exxon prediction — In 1980, the level of atmospheric CO2 was about 340 ppm (V). Exxon predicted that this level would increased by an am mount 80 ppm over the next 40 years.
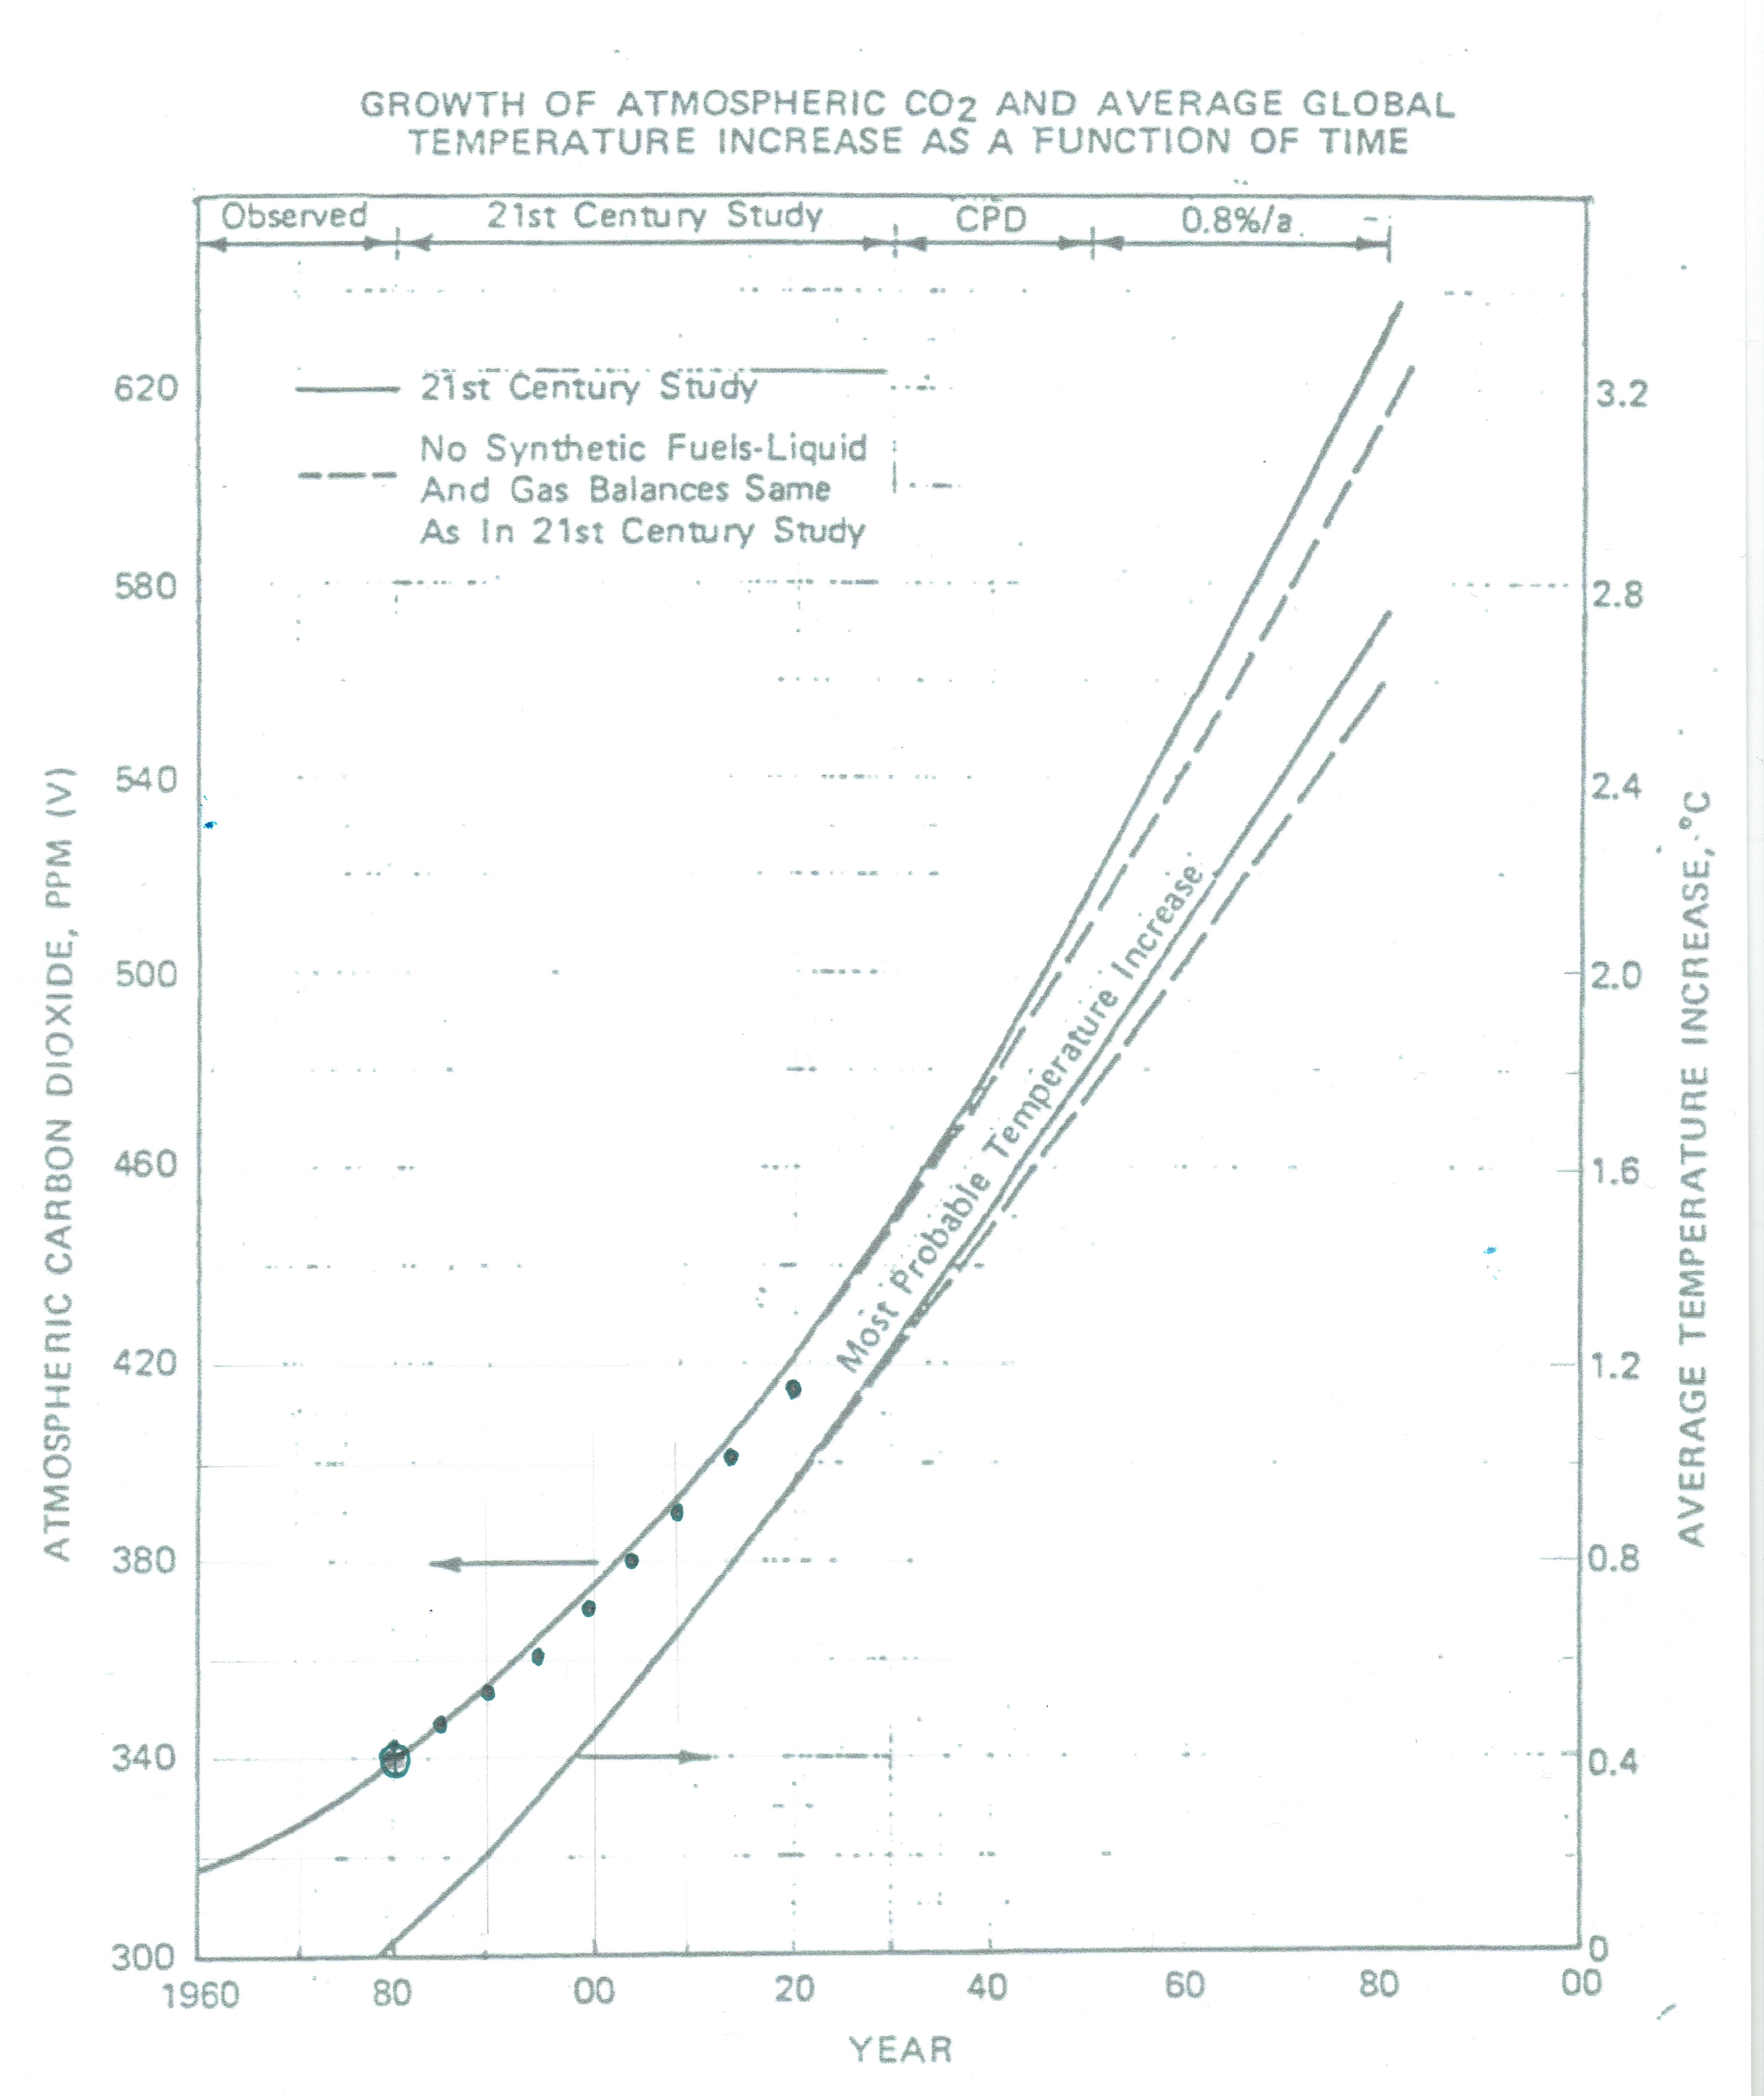
2020 Data — From 1980 to 2020, atmospheric CO2 increased by an amount 74 ppm to reach a value of 414 ppm.
This prediction is amazingly correct, being about 10% higher that the data obtained 40 years later!
Earth Global Temperature — NASA
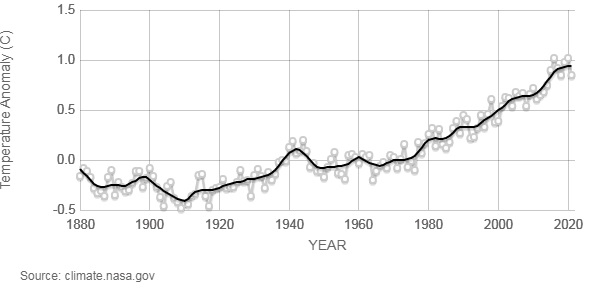
This graph illustrates the change in global surface temperature relative to 1951-1980 average temperatures. This research is broadly consistent with similar constructions prepared by the Climatic Research Unit and the National Oceanic and Atmospheric Administration.
“Look deep into nature and you will understand everything better.”
Einstein
Exxon prediction — Exxon noted that the most widely accepted science at the time indicated that doubling carbon dioxide levels would cause a global warming of 3°C.
Therefore, based on their expectation of the CO2 increase, Exxon predicted a rise of about 1.0° Celsius by year 2020.
2020 Data — From 1980 to 2020, global temperature has increased by about 0.8° C.
This prediction is also very good, but it overestimates the real increase in temperature by 25%.
Half of this overestimate follows from the fact that they had predicted a value of CO2 level 10% too high.
The other half is simply a mistake, as I explain in a technical section below. (See: Radiative forcing)
“Competitive intelligence, sometimes referred to as corporate intelligence, refers to the ability to gather, analyze, and use information collected on competitors, customers, and other market factors that contribute to a business’s competitive advantage. Competitive intelligence is important because it helps businesses understand their competitive environment and the opportunities and challenges it presents.”
Conclusions
The predictions of the Exxon paper are amazingly accurate. Would you dare predicting anything (let alone with a 10% accuracy) about year 2060?
Please, keep in mind that in those years, the CIA expected a new ice age! Obviously, Corporate Intelligence beats the Central Intelligence Agency. I wonder why?
Many people are shocked that Exxon was aware of climate change, as early as 1977. Allow me to add to their stupor.
The first calculation of climate sensitivity that used detailed measurements of absorption spectra, as well as the first calculation to use a computer for numerical integration of the radiative transfer through the atmosphere, was performed by Syukuro Manabe and Richard Wetherald in 1967.

Assuming constant humidity, they computed an equilibrium climate sensitivity of 2.3 °C per doubling of CO2. [The work has been called “arguably the greatest climate-science paper of all time”. Manabe was awarded the 2021 Nobel Prize in Physics]
The carbon dioxide data on Mauna Loa constitute the longest record of direct measurements of CO2 in the atmosphere. They were started by C. David Keeling of the Scripps Institution of Oceanography in March of 1958 at a facility of the National Oceanic and Atmospheric Administration.
The conclusion is inescapable. In 1967, there was already a decade of CO2 data and experts could have estimated future levels as Exxon did in 1982.
Based on such prediction and the calculation of Syukuro Manabe, it would have been straightforward to predict Earth global temperature increase for at least the next 50 years!
Allow me to make a final point. How did Exxon manage to get away with this? Actually, it was rather easy.
They knew that people do not believe in science. And therefore they expected that people would not believe in global warming until it is being observed.
But they also knew that it would take many decades (probably as much as 40 years) before global warming increases temperature above natural fluctuations which are of the order of 0.5°C.
Therefore, they concluded that governments would not do anything before at least 2020.
And this is another absolutely correct prediction!
“We’ve arranged a global civilization in which most crucial elements profoundly depend on science and technology. We have also arranged things so that almost no one understands science and technology. This is a prescription for disaster. We might get away with it for a while, but sooner or later this combustible mixture of ignorance and power is going to blow up in our faces.”
Carl Sagan
The Demon-Haunted World: Science as a Candle in the Dark
Facts vs Opinions
Everyone is entitled to his own opinion, but not to his own facts. The increase of CO2 level is pushing global temperature in a predictable way. That is a fact. Truth matters.
Your opinion about a fact is a different issue…
On April 29 2019, the Brussels Times wrote:
“As early as in 1896, a scientist was warning against the potential negative effects of CO2 emissions, the Nobel Committee mentioned on Twitter on Monday. Svante Arrhenius was the first person to quantify the responsibility of CO2 in the greenhouse effect, in an article published in the Philosophical Magazine and Journal of Science.“
Nothing could be further from the truth. Arrhenius believed that human emission of CO2 would be strong enough to prevent the world from entering a new ice age, and that a warmer earth would be needed to feed the rapidly increasing population. Here is what Arrhenius actually wrote:
“We may find a kind of consolation in the consideration that here, as in every other case, there is good mixed with the evil. By the influence of the increasing percentage of carbonic acid in the atmosphere, we may hope to enjoy ages with more equable and better climates, especially as regards the colder regions of the earth, ages when the earth will bring forth much more abundant crops than at present, for the benefit of rapidly propagating mankind.”
Svante August Arrhenius
(Nobel Prize 1903)
Technical Note — Radiative forcing
A simplified first-order approximation expression for carbon dioxide forcing is:

where C is the CO2 concentration in parts per million (ppm) by volume and C0 is the reference concentration.
Radiative forcing can be used to estimate a subsequent change in steady-state (often denoted “equilibrium”) surface temperature (ΔT) arising from that forcing via the equation:

where λ is commonly denoted the climate sensitivity parameter, usually with units K/(W/m2), and ΔF is the radiative forcing in W/m2. A typical value of λ is around 0.8 K/(W/m2).
Therefore, if the CO2 mixing ratio in the atmosphere were to become double, the temperature is expected to increase by 3.0° C.
Indeed,
,
usually rounded as 3.0°C.
Or to use the 2060 Exxon predictions mentioned in the introduction (540 ppm, 2.0°C):

A small mistake — When we used the values 340 (1980) and 420 (predicted by Exxon for year 2020), we obtain:

If you look at the graph, you will notice that the Exxon prediction is close to 1.0° (Maybe 0.97) which is clearly a mistake.
Obviously, the temperature line was either calculated or plotted incorrectly around year 2020. That kind of things happens when you work in secrecy…
Finally, if we use the value 340 (1980) and the now known value of 414 for year 2020, we obtain:

which is in excellent agreement with the latest measurements.
UPDATE (April 22 2022) — World Earth Day — How accurate were EXXON predictions about Global Warming? [UPDATE : INTEL TODAY predictions for 2040]
World Earth Day is a reminder for mankind to protect and safeguard the mother earth and its species, to make Earth a better place for the coming generations. April 22 2022 marks 52 years of Earth Day.
As a wise guy famously said: “Prediction is very difficult, especially if it’s about the future!”
Yet, in the early 80s, EXXON scientists made very accurate predictions about future atmospheric carbon dioxide concentrations and the rise of Earth average temperature.
Some people argue that such kind of predictions usually fail because our planet is too complicated to be predicted with accuracy. Maybe…
But the task is obviously not impossible. Here is the trick. If you wish to be good at predicting the future, you must ban all prejudices from your equations.
And of course, predictions — even if accurate — are completely useless if you cannot communicate them in simple, clear and unambiguous terms. Remember: Humans are wired to avoid uncertainty.
Data Input — The U.S. Energy Information Administration (EIA) is the principal agency of the U.S. Federal Statistical System responsible for collecting, analyzing, and disseminating energy information to promote sound policy making, efficient markets, and public understanding of energy and its interaction with the economy and the environment.
Their past estimates and predicted CO2 emissions are listed in columns 2 and 3 in in billion metric tons.
From these data and predicted emissions, future atmospheric carbon dioxide concentrations can be safely calculated. (Column 5)
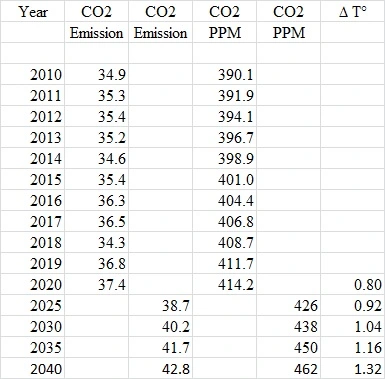
Global Temperature prediction — Finally, from these predicted carbon dioxide concentrations, one can make a prediction regarding according to the simple model explained in this post. (Column 6)
In conclusion, INTEL TODAY predicts that Earth average temperature will rise by about 0.12° C every five years until 2040.
PS — Keep in mind that this is the temperature rise above the 1951-1980 average. The rise of temperature relative to pre-industrial era is obtained by adding 0.16° C.
Thus, Intel Today predicts that the Earth average temperature will rise by 1.5° C relative to pre-industrial era in 2040.
A catastrophic event, such as a major volcanic eruption or a nuclear war, could of course alter this scenario. Happy Earth Day!
END of UPDATE
REFERENCES
Trends in Atmospheric Carbon Dioxide — NOOA
“These data are made freely available to the public and the scientific community in the belief that their wide dissemination will lead to greater understanding and new scientific insights.”
https://gml.noaa.gov/webdata/ccgg/trends/co2/co2_annmean_mlo.txt
year mean unc
1976 332.03 0.12
1977 333.84 0.12
1978 335.41 0.12
1979 336.84 0.12
1980 338.76 0.12
1981 340.12 0.12
1982 341.48 0.12
1983 343.15 0.12
1984 344.85 0.12
1985 346.35 0.12
1986 347.61 0.12
1987 349.31 0.12
1988 351.69 0.12
1989 353.20 0.12
1990 354.45 0.12
1991 355.70 0.12
1992 356.54 0.12
1993 357.21 0.12
1994 358.96 0.12
1995 360.97 0.12
1996 362.74 0.12
1997 363.88 0.12
1998 366.84 0.12
1999 368.54 0.12
2000 369.71 0.12
2001 371.32 0.12
2002 373.45 0.12
2003 375.98 0.12
2004 377.70 0.12
2005 379.98 0.12
2006 382.09 0.12
2007 384.03 0.12
2008 385.83 0.12
2009 387.64 0.12
2010 390.10 0.12
2011 391.85 0.12
2012 394.06 0.12
2013 396.74 0.12
2014 398.87 0.12
2015 401.01 0.12
2016 404.41 0.12
2017 406.76 0.12
2018 408.72 0.12
2019 411.66 0.12
2020 414.24 0.12
GLOBAL LAND-OCEAN TEMPERATURE INDEX — NASA
Land-Ocean Temperature Index (C)
Year No_Smoothing Lowess(5)
1976 -0.10 0.04
1977 0.18 0.08
1978 0.07 0.12
1979 0.17 0.17
1980 0.26 0.20
1981 0.32 0.21
1982 0.14 0.22
1983 0.31 0.21
1984 0.16 0.21
1985 0.12 0.22
1986 0.18 0.24
1987 0.32 0.27
1988 0.39 0.31
1989 0.27 0.33
1990 0.45 0.33
1991 0.41 0.33
1992 0.22 0.33
1993 0.23 0.33
1994 0.32 0.34
1995 0.45 0.37
1996 0.33 0.40
1997 0.46 0.42
1998 0.61 0.44
1999 0.38 0.47
2000 0.39 0.50
2001 0.54 0.52
2002 0.63 0.55
2003 0.62 0.59
2004 0.54 0.61
2005 0.68 0.62
2006 0.64 0.63
2007 0.67 0.64
2008 0.54 0.64
2009 0.66 0.64
2010 0.72 0.65
2011 0.61 0.67
2012 0.65 0.70
2013 0.68 0.74
2014 0.75 0.79
2015 0.90 0.83
2016 1.02 0.88
2017 0.92 0.91
2018 0.85 0.92
2019 0.98 0.93
2020 1.02 0.94
=
Corporate Intelligence — How accurate were EXXON predictions about Global Warming?
World Earth Day — How accurate were EXXON predictions about Global Warming? [UPDATE : INTEL TODAY predictions for 2040]
Corporate Intelligence — How accurate were EXXON predictions about Global Warming? [UPDATE : Intel Today analysis plagiarized by SCIENCE Magazine]
