
“Few scientific fields have a single metric that both insiders and outsiders obsess over as much as infectious disease epidemiology’s basic reproductive number, R0.”
Professor Alison Hill — Institute for Computational Medicine and the infectious disease dynamics group at Johns Hopkins University

November 12 2020 — All over the world, major intelligence agencies are involved in the fight to end the current pandemic. I intend to discuss these efforts in the future posts but first, I must define a few concepts. Follow us on Twitter: @INTEL_TODAY
RELATED POST: COVID-19 — Why has Belgium the highest death rate in the world? [UPDATE II]
RELATED POST: ODNI — Intelligence Community Statement on Origins of COVID-19 [POLL]
RELATED POST: COVID-19 — The Boy Who Cried Wolf [Is Pompeo telling the truth about the Wuhan Lab?]
RELATED POST: COVID-19 — Brussels Top Politicians Caught Helping Chinese Disinformation
RELATED POST: Coronavirus — “Potential Emergence of a Global Pandemic” [NIC — Global Trends 2025 (November 2008)]
RELATED POST: COVID-19 — Mike Pompeo : “Enormous Evidence Virus Originates from Wuhan Lab” [UPDATE]
RELATED POST: COVID-19 — A Simple Method to Predict the Second Peak
“I don’t see why two-thirds should lose their freedom because one-third is dithering. For me, it is clear that there should be no lockdown for the vaccinated out of solidarity for the unvaccinated.”
Chancellor Alexander Schallenberg
UPDATE (November 12 2021) — The Upper Austria region will be the first to move into level five of Austria’s five-stage incremental government plan agreed in September 2021.
The province has the lowest vaccination rate and the highest infection rate of Austria’s nine provinces.
Once 30% of intensive-care beds are occupied by Covid-19 patients, people not vaccinated against the coronavirus are placed under lockdown.
Accordingly, starting this coming Monday, those who are not vaccinated will have restrictions placed on their daily movements.
Currently, the unvaccinated are already banned from going to restaurants, cinemas, ski lifts and hairdressers.
Once the plan is activated, they won’t be able to leave home, unless it is for essential reasons like going to work or buying food.
END of UPDATE
“At the end of the day, this delta variant is much more transmissible than the alpha variant. That’s the message people need to take from this.”
CDC official (August 12 2021)
UPDATE (August 13 2021) — The SARS-CoV-2 R0 value has risen over the course of the pandemic as the virus evolved.
The initial COVID-19 strain had an R0 between two and three. The alpha variant emerged, likely in the U.K., and was more transmissible than the original strain.
A few months later, the delta variant emerged, most likely in India. For the delta variant, the R0 is now calculated at between six and seven. [NPR — The Delta Variant Isn’t As Contagious As Chickenpox. But It’s Still Highly Contagious]
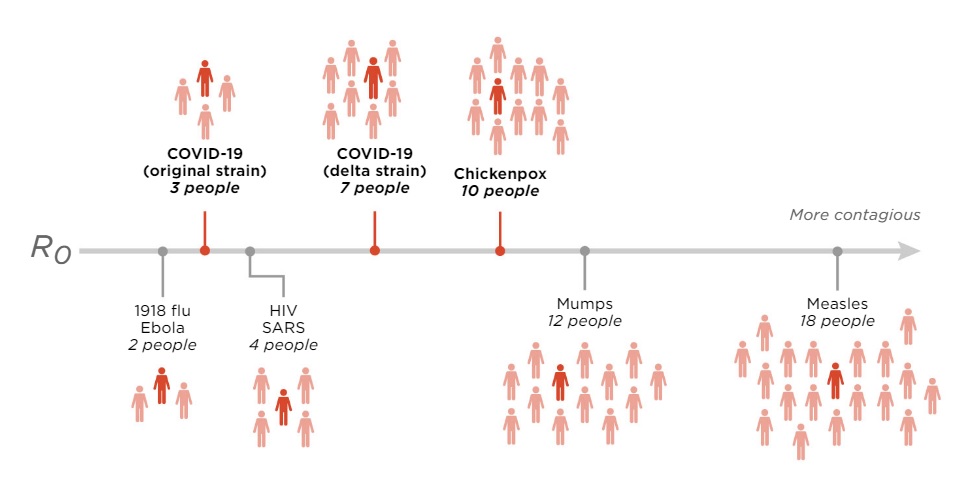
With an R0 of six, delta will be extremely difficult to slow down unless populations reach high levels of vaccination.
The vaccine is less than 90% effective at stopping infections with delta, meaning at least 1 in 10 people could have breakthrough infections.
And vaccinated people can still spread the virus. In addition, people who aren’t vaccinated have a very high risk of infection.
On top of that, the protection provided by the COVID-19 vaccines appears to to fade significantly after about 6 months. Expect the best, but prepare for the worst.
END of UPDATE
“Anyone that chooses not to get vaccinated will in all likelihood get infected by the delta variant over the coming months.”
Tom Wenseleers — University of Leuven, Belgium (August 12 2021)
November 12 2020 — The 2011 film Contagion is certainly entertaining but it is not accurate when explaining the math behind an epidemic.
Jude Law’s Alan Krumwiede is a British blogger based in San Francisco who launches a crusade to try and expose what he believes is a conspiracy by both the government and the pharmaceutical companies to hide the truth about the deadly virus – and make money on a possible cure. [1]
“On day one, there were two people. And then, four and then, sixteen. In three months, it’s a billion. That’s where we’re heading.”
Alan Krumwiede — Contagion
In a tense scene, Alan Krumwiede describes the spread of the pandemic as being a problem you can do on a napkin.
Using a value of 2 for 
That is utter nonsense. For starter,
RELATED POST: Havana Syndrome — A Quiet Revolution [May 20 2019]
Moreover, one should always keep in mind that it is never easy to estimate
“What is the current level of Covid-19 transmission in the UK? This might sound like a straightforward question, but take a moment to think about what it’s actually asking. Are we interested in how many people will catch the virus from those currently infected? If so, this transmission hasn’t finished yet, which means we’d have to try to predict it somehow.
Or maybe the question implies we look backwards, and work out how much transmission there was when people who are currently infected originally picked up the virus. If so, what data should we use to do this? And how confident can we be in the results? These are the sorts of questions that epidemiologists around the world have been grappling with since January, against a background of changing transmission and uncertain knowledge.”
Adam Kucharski — Professor in infectious disease epidemiology at the London School of Hygiene & Tropical Medicine and author of The Rules of Contagion: Why Things Spread – and Why They Stop
What is R0 ?
Easy to define but hard to estimate
Roughly speaking, R0 depends on the product of three factors:
— the contact rate, or the number of people an infected individual interacts with each day
— the transmissibility, or the probability per unit time that any given contact results in transmission
— the infection duration
The goal of most infectious disease control efforts is to reduce R0 by altering one or more of those components.
A Mathematical Model of R0
The number of secondary infections is often summarized by a negative binomial distribution:


k parameterizes the dispersion of secondary infections,

and 
Average and Variance
If all individuals have the same intrinsic infectiousness — that is, the variance is low (blue scenario on the right top pic) — then the number of secondary infections is expected to have a Poisson distribution (k→∞).

If the infectiousness is heterogeneous, the distribution is said to be over-dispersed and has a lower k, that is the variance is high. (yellow scenario on the right top pic)
Over-dispersion implies that a small number of individuals are responsible for a large percentage of secondary infections, whereas most others infect no one.

For COVID- 19 worldwide, a few studies have estimated k ≈ 0.5, albeit with high uncertainty.
From Mathematical Modelling to Policy Making
Let us assume for a moment that you are the boss. Would you order a general lockdown if the data show that a small fraction of the population is spreading the virus?
Or would you rather order a targeted/partial lockdown?
In Belgium, which has one of the highest infection rates in Europe at the moment, the virologist and government adviser Marc Van Ranst pointed to Germany’s partial lockdown in a tweet on 29 October, commenting: “We could and should have done this six weeks ago.”
Brussels, European capital of the COVID-19
Belgium is clearly the European center of the pandemic and no one is denying the truth anymore.
According to the European Centre for Disease Prevention and Control, the “14-day cumulative number of COVID-19 cases per 100 000” is 1498.7 for Belgium. For comparison, the number for Germany is 168.4!
Considering the gravity of the situation, you would think that Belgian experts have a pretty good math modelling of the pandemic. So, what is the value of k in Belgium?
So far we do not know… At least, we have not been told. Why on earth not?
To begin with, there is no large-scale testing, no serious tracing and no analysis of waste-waters.
In fact, not only ‘contact tracing’ is still not working, there is not even an attempt to use it efficiently to fight the pandemic.
In Belgium, the ‘contact tracing’ is merely forward looking, designed to locate people who have been exposed to an infected person.
What is needed is a ‘contact tracing’ that tracks backwards from that person to identify an outbreak’s source.
Why was it not done? Belgian politicians are mostly trying to satisfy as many of their voters as possible in order to stay in power.
A targeted lockdown could be very costly to a political party which gets a large number of votes from a super-spreading community.
If people knew that a lockdown is imposed on all of them because a small group is largely responsible for the transmission of the virus, there would be a revolution.
PS — Did you know… Some of today’s most prolific infectious disease modelers originally trained as physicists, including Neil Ferguson of Imperial College London, an adviser to the UK government on its COVID- 19 response, and Vittoria Colizza of Sorbonne University in Paris, a leader in network modeling of disease spread.
To the best of my knowledge, there is not a single physicist among the ‘experts’ advising the Belgian government.
Pieter Bruegel’s “The Blind Leading the Blind” is of course one of the most famous Flemish Renaissance paintings. Not without reason…
How Infection Spread | Contagion
REFERENCES
[1] On Monday (Nov. 9 2020), Pfizer CEO Albert Bourla cashed in on his company’s coronavirus vaccine breakthrough. The executive sold more than $5.5 million worth of Pfizer stock
Contagion: How to Model It and What R-nought (R0) Actually Means — Dr Duncan Robertson
The Math Behind Epidemics — Alison H. Hill
=
COVID-19 — From Mathematical Modelling to Policy Making
COVID-19 — From Mathematical Modelling to Policy Making [UPDATE — CDC Report : “COVID delta variant is as transmissible as Chicken Pox.”] [MEDINT]
One Year Ago — COVID-19 : From Mathematical Modelling to Policy Making [UPDATE — Austria imposes Covid lockdown for unvaccinated people] [MEDINT]
